You're Probably Tracking the Wrong Numbers
The KPI Dashboard That Actually Drives Better Decisions
Revenue and profit only tell part of the story.
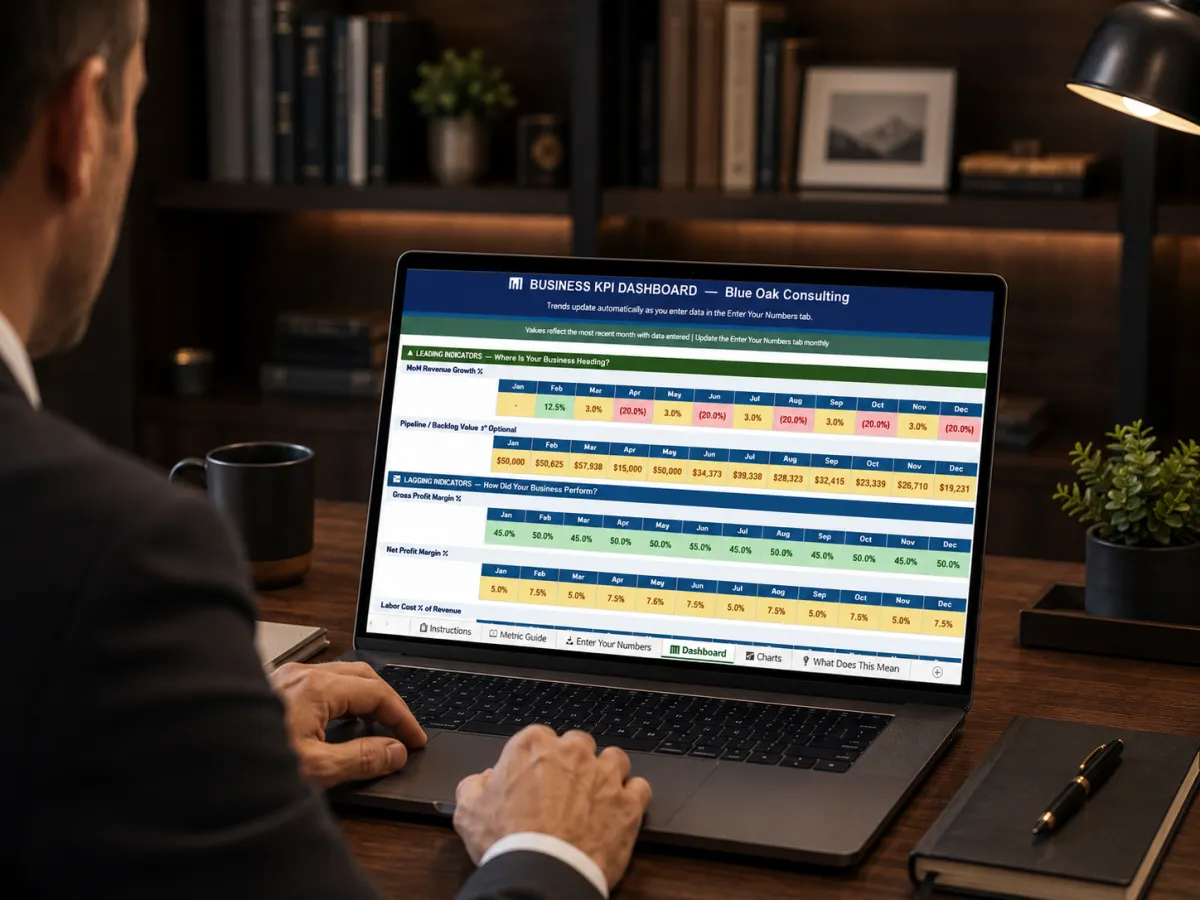
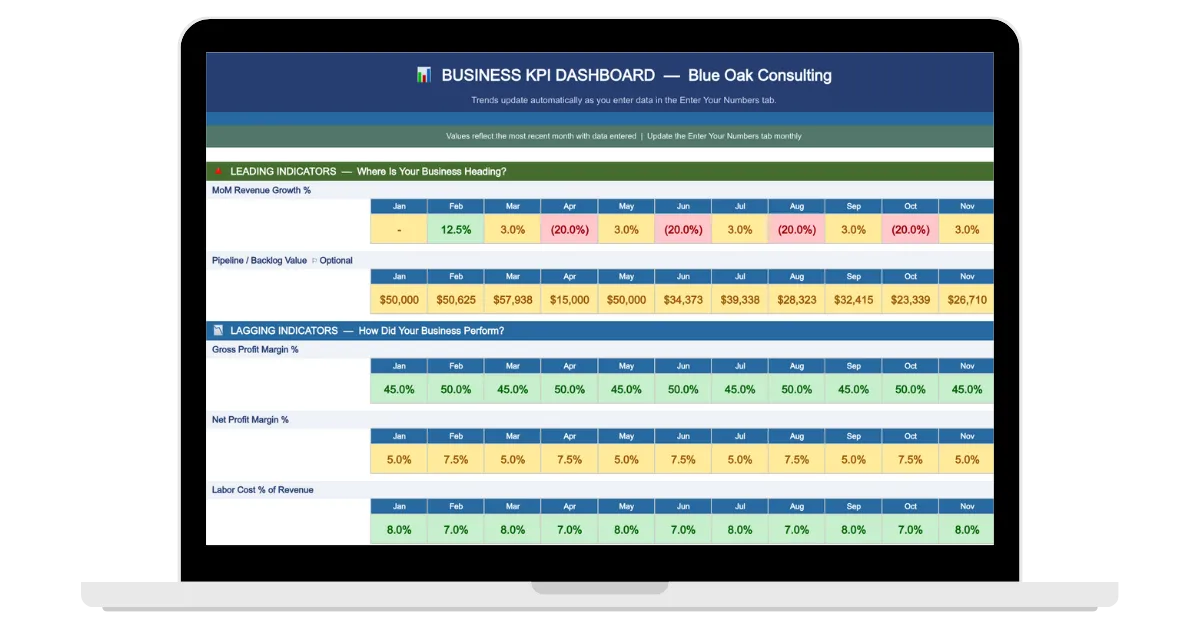
This free KPI Dashboard helps you track the financial and operational metrics behind cash flow,
margins, pipeline, backlog, and overall business health.
Built by a fractional CFO who works inside manufacturing and trades businesses every day.
Are You Tracking the Right KPIs?

Does Any of This Sound Familiar?
You're not failing. You just don't have the right numbers in front of you.
"I'm profitable on paper, but cash is always tight."
Cash flow and working capital tell a different story.
I don't know if my costs are really under control.
Margin trends reveal problems long before the P&L does.
"I always seem to react instead of getting ahead."
Leading indicators help you spot issues before they become emergencies.
"I need CFO-level insight without hiring a full-time CFO."
That's exactly what this dashboard was built to provide.
If even one of those hits, this dashboard was built for you.
Get Clarity in 3 Simple Steps
No complicated setup. No financial expertise required.
1 - Enter Your Numbers
Simply enter a few key business metrics.
✅ No formulas to build
✅ No other spreadsheets to maintain
✅ No accounting degree required
2 - Let the Dashboard Do the Work
The dashboard automatically calculates and organizes:
✅ Revenue Growth
✅ Pipeline & Backlog
✅ Gross Profit Margin
✅ Net Profit Margin
✅ Working Capital
✅ Cash Flow Trends
✅ Days Sales Outstanding (DSO)
✅ and more
✅ Revenue Growth
✅ Pipeline & Backlog
✅ Gross Profit Margin
✅ Net Profit Margin
✅ Working Capital
✅ Cash Flow Trends
✅ Days Sales Outstanding (DSO)
✅ and more
3 - See What Your Numbers Are Telling You
Instantly view color-coded indicators, benchmark ranges, and plain-English explanations to understand:
✅ Whether your business is healthy
✅ Where risks may be developing
✅ Which areas need attention
✅ What trends deserve a closer look

The More Your Business Grows, The More Visibility Matters
As businesses grow, so does complexity
More employees
More customers
More expenses
More decisions
And with growth comes a greater need to understand what's happening beneath the surface.
Without a KPI framework, many owners discover issues only after they affect:
Cash Flow
Profitability
Hiring plans
Expansion opportunities
Relationships with lenders and investors
The sooner you identify a trend, the more control you have over the outcome.
It's about making better decisions before problems become expensive.
What Business Owners Are Discovering Through KPI Visibility
Who This KPI Dashboard Is For
This is built for business owners who want more visibility without the complexity of financial jargons and spreadsheet formulas.
You own a business in manufacturing, industrial, trades, or a related sector doing $1M–$25M in revenue
You have QuickBooks (or equivalent) but no meaningful view of what the numbers actually mean for your business
You've been surprised by a bad month or a tight cash month when profit looked fine
You're managing by feel because building a tracking system just isn't your job
You've grown to the point where gut feel isn't enough, but a full-time CFO isn't justified yet
You're preparing for a growth push, a bank conversation, or a potential sale and need clean financial visibility first
You want the same infrastructure a CFO builds without the CFO price tag
You need a tool you'll actually open because it tells you something useful every month
If you run the business but don't run the financials with confidence, this is your starting point.